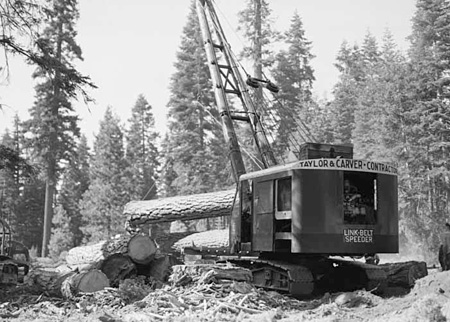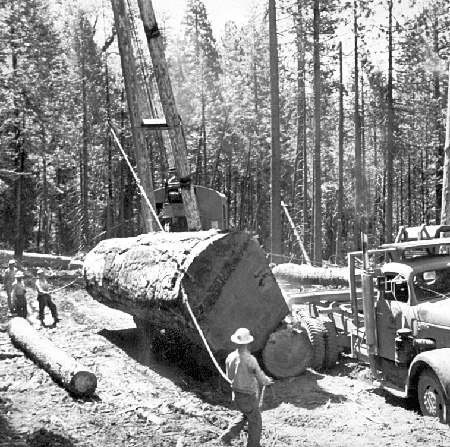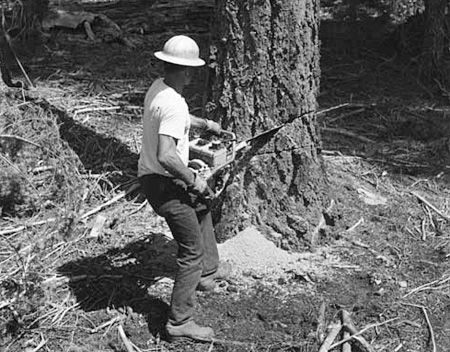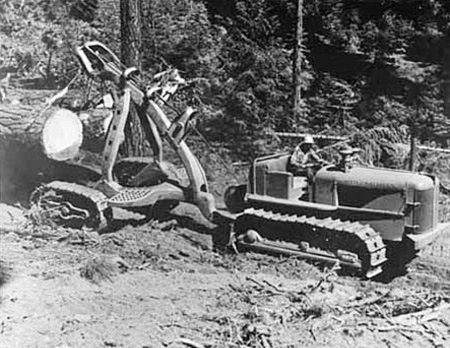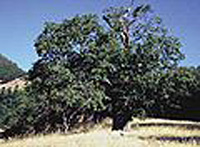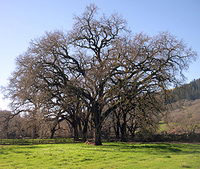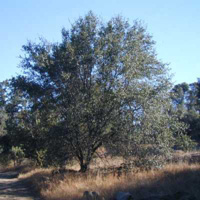
The forests of the Mother Lode region generally and El Dorado County specifically have been "managed" for centuries. Native Americans used fire as a tool to control the undergrowth for purposes of food gathering and for hunting to expose game. It was not until the early 1850s, though, and the coming of gold miners that large scale changes to the forest cover of the region began to occur.
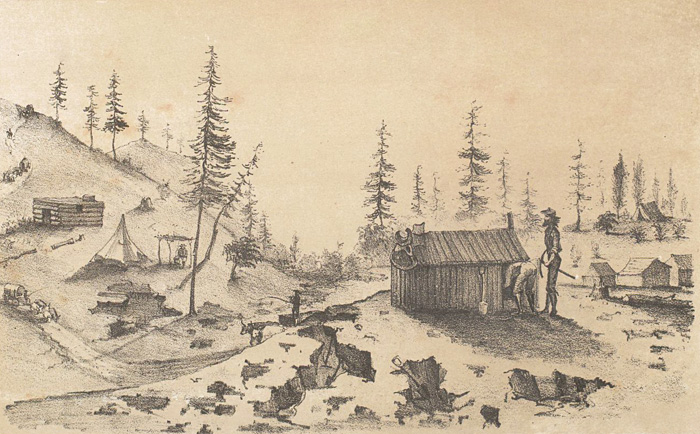
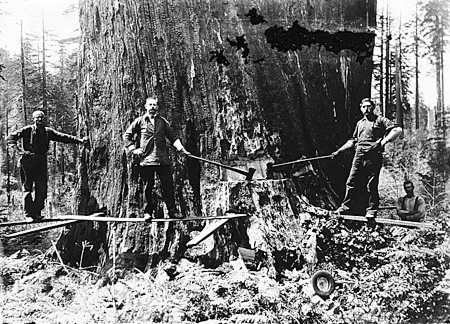
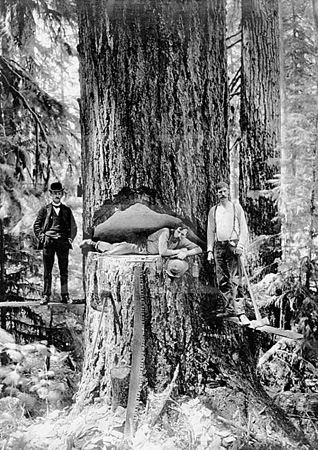
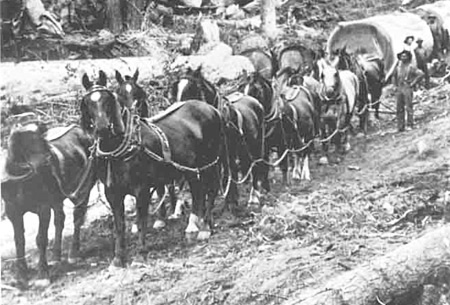
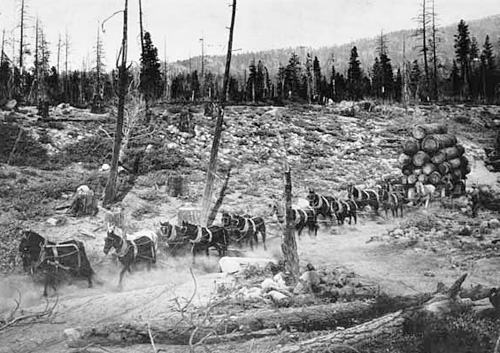
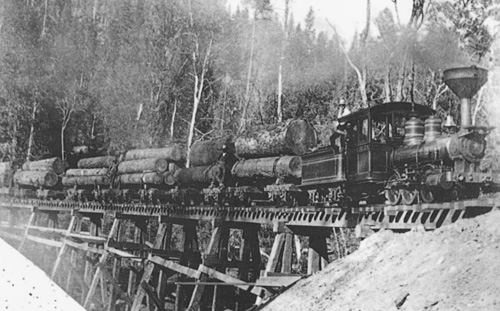
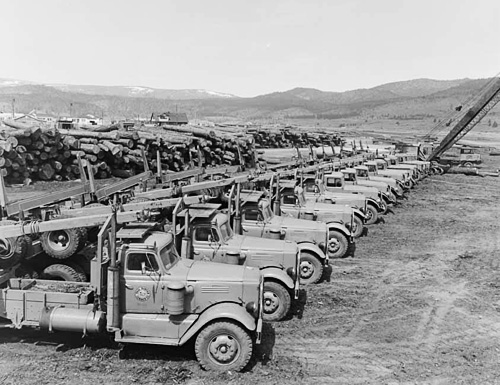
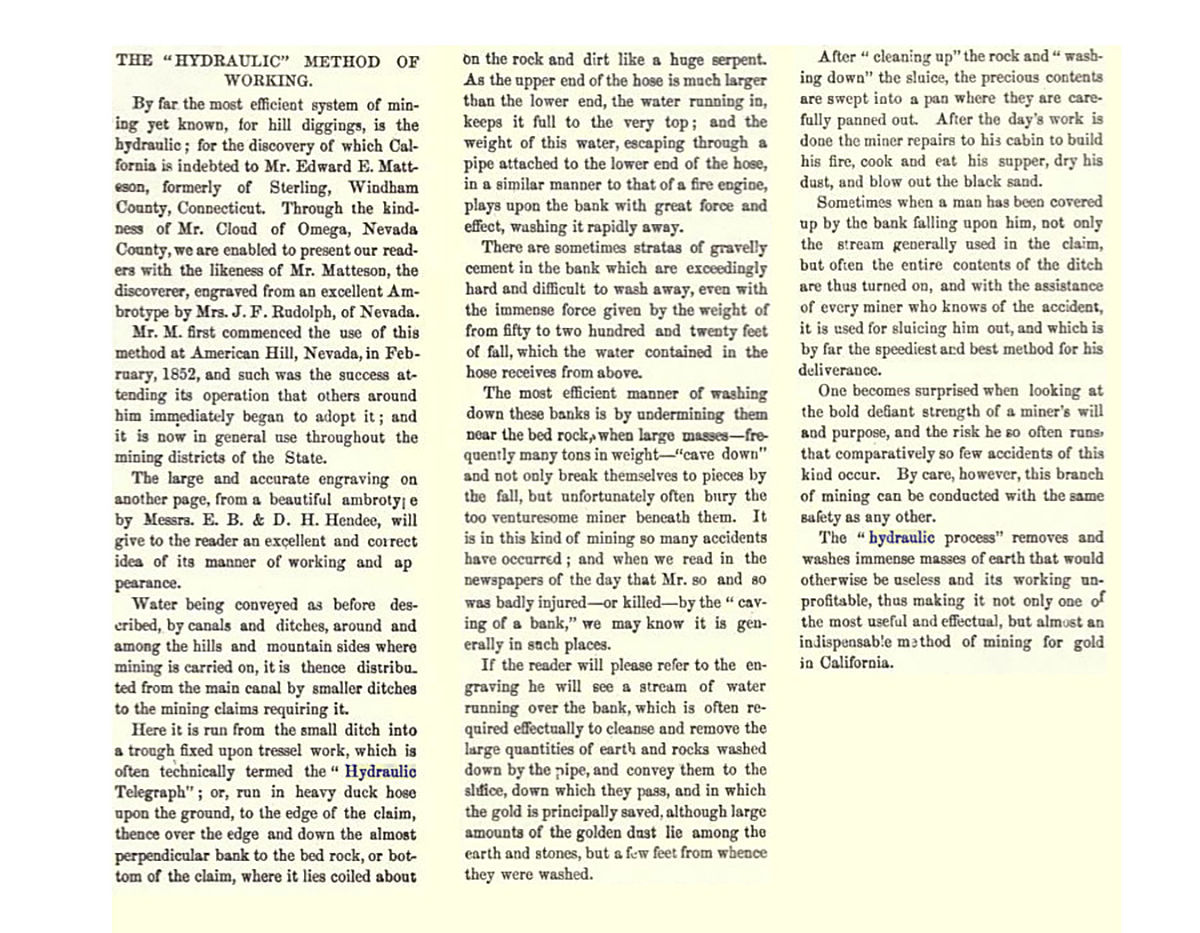
Descriptions of the forests of El Dorado County and the Mother Lode and of forest practices from the time of the gold rush and on into the twentieth century are available from a variety of sources. The items below include a poet's essay, an artist's portrait of a mining camp, photographs of logging technology, maps, and historic logging data. Study each of the sources, taking notes as suggested.
Source
Notes
As you study each source take notes related to:
- your first impressions
- the size of the timber involved
- the way in which the forest was impacted
- the logging and transportation technology involved
- the extent of the impact on the forest that the technology allowed
1) The description of the Shasta County forest by Joaquin Miller was written in the 1850s during the gold rush. Contrast his broad view of the forests that "defy the advance of civilization into their ranks" with what was depicted in The Yankee House drawing.
2) Discuss the degree to which the changes in logging technologies you see pictured allowed more or less timber to be cut.
3) Bold contour lines in the Wieslander Map are at 500 foot intervals; light lines, 100 feet. Study the map and give a general description of what tree species predominate at elevations ranging from 1500 to 2500 feet above sea level. (Remember that you can zoom in on the map using the controls in the upper left.)
4) Timber production in California peeked in the 1950s and then again in the mid 1980s. Is this same general pattern true across the Mother Lode counties?
5) Zoom in on different regions of the Clear Cuts map. Describe and explain the different colors in the various regions of the map.
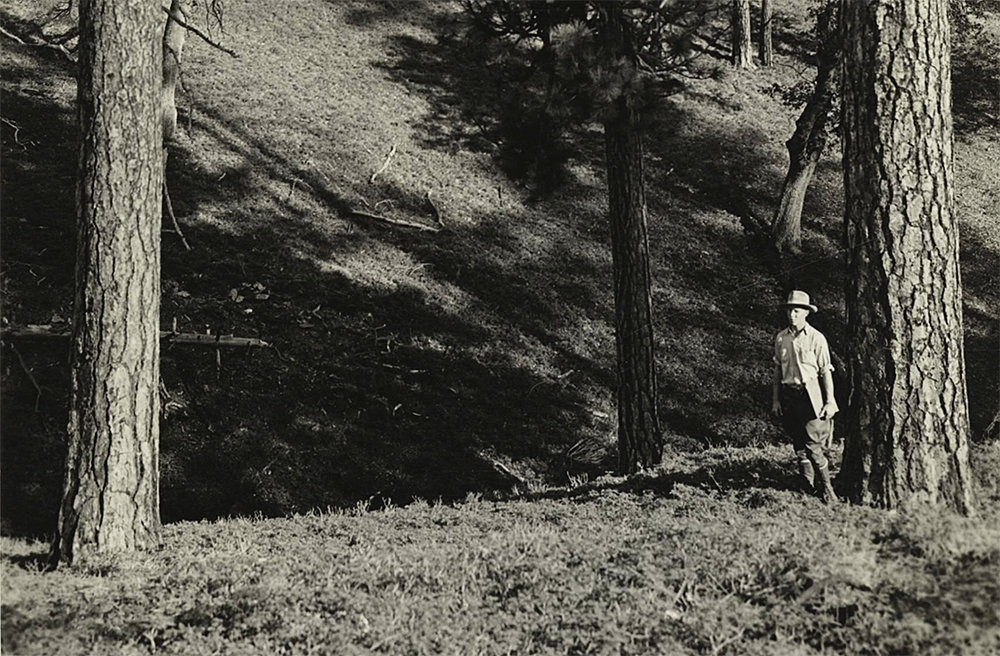
Changes in forest use practices, climate, and human culture have had a significant impact on the ecology of the Mother Lode. We have a unique insight into the resulting changes as a result of a study that was led by Albert Wieslander of the University of California at Berkeley during the 1920s and 30s. Wieslander’s project inventoried and photographed thousands of sites across the state resulting in detailed vegetative maps like the one you examined above. Much of this work has been made available digitally in the last decade and provides a unique window into the state’s biological history and a basis for studying change over the last seventy years. The Pleasant Valley Map gives you access to data and photos for a few of the Wieslander sites in El Dorado County. For each site you will find a data sheet from the inventory done there in the 1930s and a photo from the 1930s alongside a contemporary photo. Use the available Note Sheet as you study each of the plot sites. You may need to make use of the Glossary of Trees and accompanying photos for help with the Latin tree names and for identification purposes.
6) Keeping in mind that it was not possible to get exactly to the same locations in 2010 where the earlier pictures were taken, describe the general changes that stand out in your review of the sites.
7) How has the size and the density of the predominant species (Ponderosa pine and oak, for example) changed over the years?
8) How would you characterize the understory vegetation (grasses and shrubs) today compared to the 1930s?
image from the Wieslander Vegetation Type Mapping Collection courtesy of the Marian Koshland Bioscience and Natural Resources Library, University of California, Berkeley, Image #265662.
1James Thorne, et. al., “Vegetation Change Over Sixty Years in the Central Sierra Nevada, California, USA,” Madrono, Vol. 55, No. 3, pp. 223-237, 2008.
