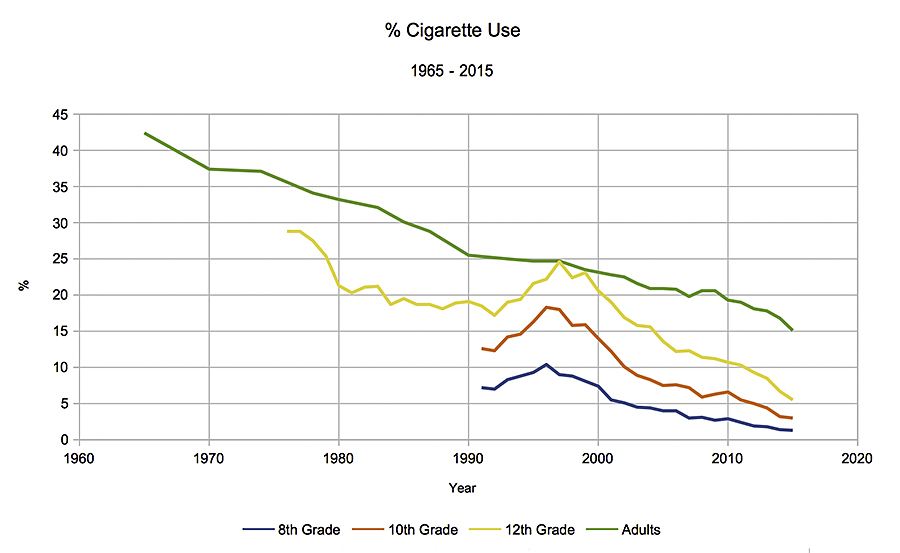
Cigarette use in general has declined dramatically since the 1960s, but somewhat differently among teenage groups.

1) Which group shown in the graph shows the greatest rate of decline? the least? Explain how you can tell.
2) One of the curious details in the graph is the dramatic bump in teen use of cigarettes in the mid 1990s that is not present among adult users. Do some research and identify factors that may have played a role in this bump. Would the factors you identified have an impact on your decision to smoke or not?
Teen smoking data from Adolescents and Tobacco: Trends, (U.S. Department of Health & Human Services: Office of Adolescent Health, 2015).