The story of the Dust Bowl as traditionally told is one of the unbridled expansion of agriculture using techniques ill suited to the grasslands of the Great Plains. The story goes that with the advent of mechanized technology, a huge growth in demand for winter wheat following World War I, and more rain than normal in the early to mid 1920s the result was an ecological disaster when drought returned to the region later in the 1920s. Recent research has put parts of the traditional story in doubt, however. Historians Geoff Cunfer and Myron Gutmann have used GIS techniques to create map overlays that suggest a somewhat different conclusion. In the following activity you will use your GIS software to examine census, soil, and climate data from the 1930s and test conclusions about the Dust Bowl for yourself.
The classic account of the Dust Bowl is by Donald Worster in his award winning book Dust Bowl: The Southern Plains in the 1930s. His thesis is laid out clearly in the introduction:
The Dust Bowl was the darkest moment in the twentieth-century life of the southern plains. The name suggests a place - a region whose borders are as inexact and shifting as a sand dune. But it was also an event of national, even planetary, significance. A widely respected authority on world food problems, George Borgstrom, has ranked the creation of the Dust Bowl as one of the three worst ecological blunders in history. The other two are the deforestation of China's up- lands about 3000 B.C which produced centuries of silting and flooding, and the destruction of Mediterranean vegetation by livestock, which left once fertile lands eroded and impoverished. Unlike either of those events, however, the Dust Bowl took only 50 years to accomplish. It cannot be blamed on illiteracy or overpopulation or social disorder. It came about because the culture was operating in precisely the way it was supposed to. Americans blazed their way across a richly endowed continent with a ruthless, devastating efficiency unmatched by any people anywhere. When the white men came to the plains, they talked expansively of "busting" and "breaking" the land. And that is exactly what they did. Some environmental catastrophes are nature's work, others are the slowly accumulating effects of ignorance or poverty. The Dust Bowl, in contrast, was the inevitable outcome of a culture that deliberately, self-consciously, set itself that task of dominating and exploiting the land for all it was worth.1
Drought happens, claims Worster, but it was American culture - expansionism, capitalism, and mechanized factory farming - that created the conditions necessary for the Dust Bowl. If true, there should be a close correlation between the areas of the worst dust bowl conditions and the most intensive plains farming. Was there? Or were there other factors that had a significant impact as well? These are questions that you will consider for yourself using available soils, climate, and agricultural data.
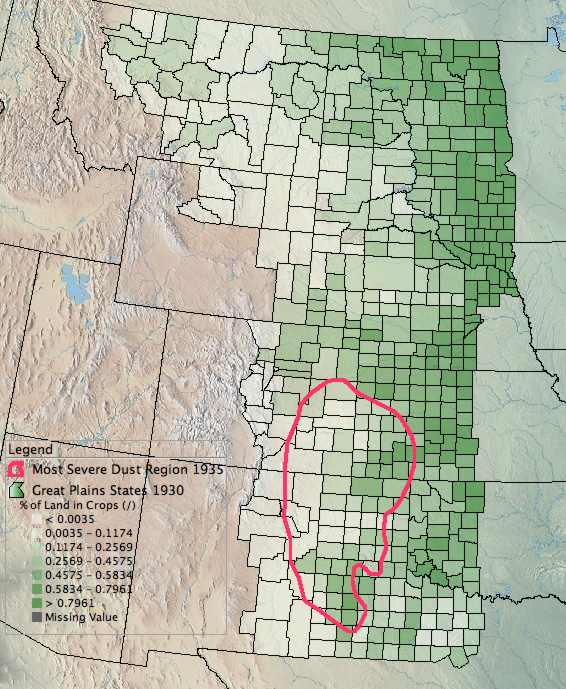
As the map at the left showing the % of Land in Crops from 1930 suggests there is some correlation between the counties where farming was practiced most intensively and the area of most severe dust storms in 1935. Over 50% of the cropland in a few of the counties in the dust region was planted in crops. But in many others the percentage was below 45%.
There were a number of other factors that may have contributed to dust activity. Livestock had grazed the plains in great numbers and concentration since the 1880s. Soils varied across the region and so did the climate. Specifically, temperatures and precipitation differed from regional averages during the 1930s. According to Geoff Cunfer in an essay entitled Causes of the Dust Bowl drought played:
...a prominent role in causing the Dust Bowl. Plowing for crops certainly exposed land to erosion, ... but ... the ways people used the land had less to do with creating dust storms than did the weather. ... It is time for environmental historians to consider the possibility that dust storms are a normal ecological disturbance that coincides with extended periods of drought and high temperatures on the southern plains, rather than evidence of human ecological failure.2
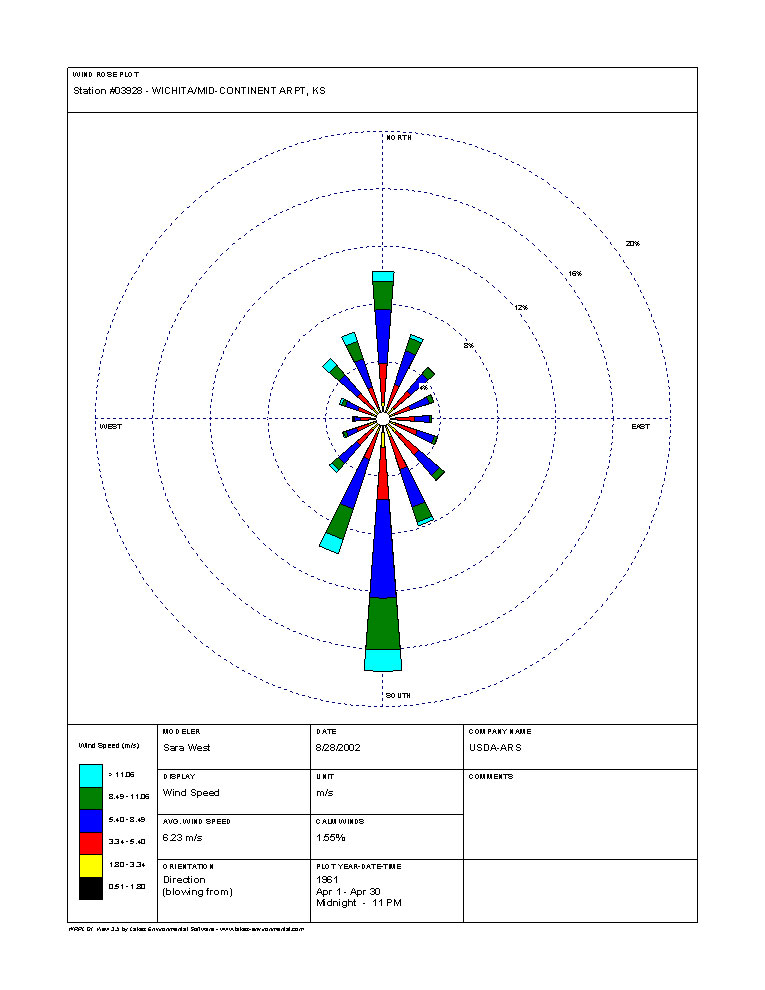
You have a limited amount of the climate and soils data that Cunfer explored in coming to this conclusion available to you. It is in the Dust Bowl: Environment map. The map contains precipitation data for the southern Great Plains across several decades as well as temperature and precipitation data from 1935 and averages for the previous five years. There are also layers showing predominate soil types in the Southern Great Plains, the percentage of sand in those soils, and the prevailing wind patterns in several Dust Bowl cities.
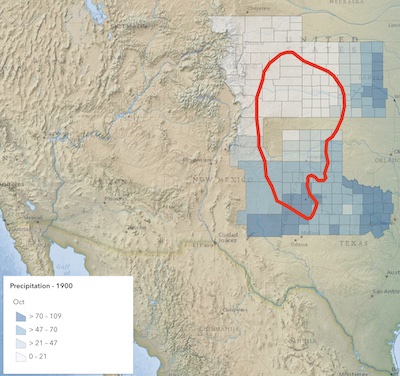
Open the map and turn on the Precipitation - 1895 layer. In this layer the annual rainfall total for each county in the Dust Bowl region is classified by natural breaks in the data. Create a similar map for each of the other Precipitation layers so that you can make a rough comparison. Notice also that the pop-up for each county contains a column graph showing percentage of the annual total for each month of the year.
1) Describe the general pattern of total annual rainfall in the region. Where typically is it wettest? driest?
2) Over the years, in what month(s) does most of the annual rainfall in the region seem to occur? the least?
3) Cunfer provides a simple model showing the amounts of annual rainfall required for successful farming of wheat and corn on the southern Great Plains:

Filter the annual rainfall total so that only counties where winter wheat can be successfully grown show. Describe the variation you observe from 1895 to 1950 and discuss the potential for a successful winter wheat crop on a regular basis.
4) The higher the percentage of sand, the more likely soil is to be susceptible to giving rise to dust storms of the sort experienced in the Great Plains during the 1930s. Sandy soil particles do not stick together as easily as clay and loam soils do especially as they dry under heavy wind and warmer than normal temperatures. Examine the information in the % Sandy Soil layer and describe your general conclusions about how sandy the soil was in the areas of most intense dust storms during the decade of the 1930s.
5) Most dust storms on the Great Plains occur in the spring.
Therefore, precipitation and temperatures in the winter and early
spring months can most affect the level of soil moisture. The
average total rainfall for the first four months of each year from
1930 - 1934 is given in the Winter/Spring Averages
field of the Environment - 1935 layer. Prepare a
data map of this information overlaid with the area of most intense
dust storms. Prepare a comparable map for the Winter/Spring
- 1935 data, the total rainfall for the first four months
of 1935. Study the maps and write a summary discussing your
conclusions.
6) How do the 1935 monthly temperatures compare with the averages
for the previous five years? Prepare data maps to help you analyze
the question and discuss your conclusions.
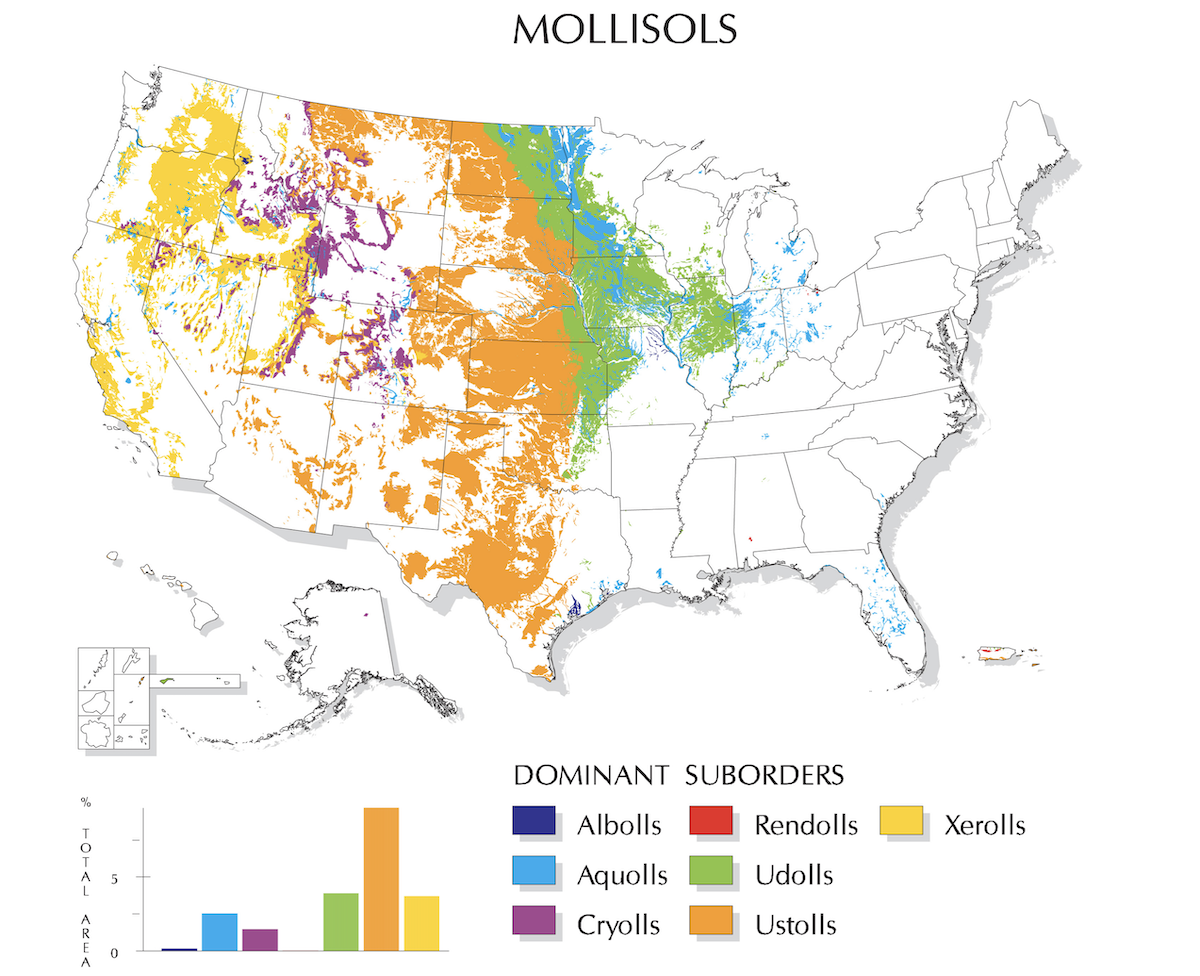
7) The existence of dust storms can also be related to soil type. The dominant type on the Great Plains is Mollisol, soil that has historically supported grass vegetation, both long and short stem. Do some research and briefly describe each of the two primary suborders of Mollisol soil in the region. Is there a relationship between these soil types and the percentage of sand in the soil? Explain.
8) Open the Prevailing Wind layer. You will find a wind rose for each of the cities indicated in the map that provides a historic summary of prevailing wind patterns in that area for the period 1960 - 1991. Assuming that wind patterns in the 1930s were much the same, describe the movement of dust across the region.
1Donald Worster, The Dust Bowl: The Southern Plains in the 1930s, 25th Anniversary Edition, (New York: Oxford University Press, 2004), p 4.
2Geoff Cunfer, "Causes of the Dust Bowl," in Anne Kelly Knowles, editor, Past Time, Past Place: GIS for History, (Redlands, California: ESRI Press, 2002), p 101.
"Mollisols Map, " (Washington D.C.: Natural Resources Conservation Service). Downloaded November 19, 2021 from USDA.
