Salmon generally spawn in gravel beds in the extreme reaches of the Columbia and other large river systems on their return from the ocean - often hundreds of miles upstream from the river's mouth. After spending three to four years at sea chinook salmon return to spawn in the streams in which they were born and then to die. The South Fork of the Salmon River and the streams that feed it in the mountains of central Idaho are one such location.
River environment is critical in terms of both the development of salmon eggs and fry as well as the salmon's migration to the sea. This environment has changed for salmon returning to the South Fork over the last century and a half - changed in ways that have contributed to large decreases in the chinook population. Dams have obviously been the largest factor. They create barriers to fish both upstream and down. However, other factors have also played an important role. These include increased commercial fishing in the Pacific and in the river itself, changes in water temperature as a result of water pooling behind dams, and changes in water clarity brought about by both naturally occurring and man-made siltation. Fire, logging, mining, farming, and road construction and use have all contributed to increased silt in the rivers and streams of the Columbia system.
Eggs deposited and fertilized in nests in the river's gravel known as redds are dependent on the movement of water through the river's rocky bed to provide oxygen for development. Excessive amounts of fine silt in the stream can work its way into the redds and literally choke off the oxygen supply to the developing eggs.1
In 1987 - 1988 Idaho Department of Environmental Quality researchers studied the relationship between the amount of fine silt in the redds of chinook salmon and egg survival in the South Fork of the Salmon River. The experiment involved placing 30 baskets with 100 salmon eggs each in known chinook redds in the Poverty Flats spawning area on the South Fork of the Salmon River. Both surface and dissolved oxygen levels were measured at each basket and in the spring living and dead salmon fry and undeveloped eggs were counted in each. The results comparing the percent fine silt in each basket and the percent of egg survival are shown in the graph below.1
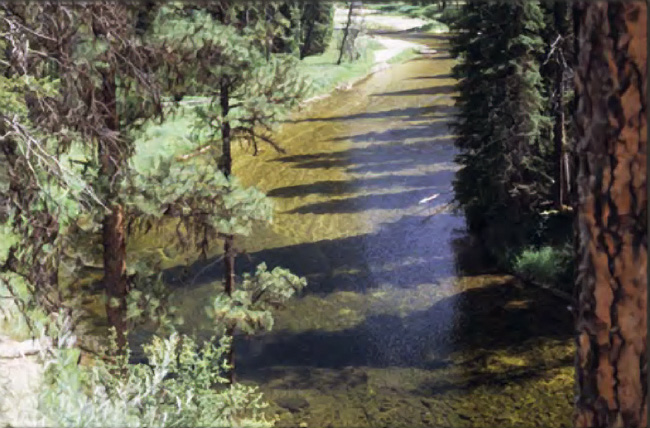
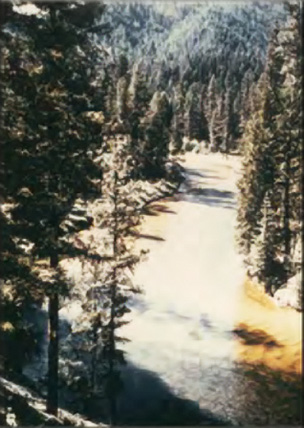
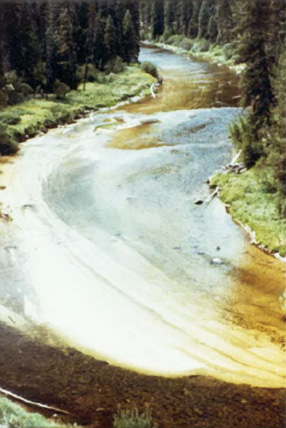
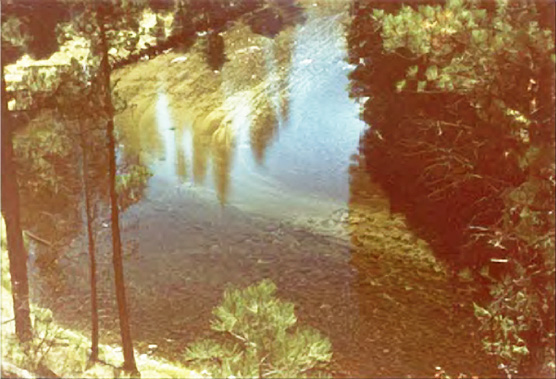
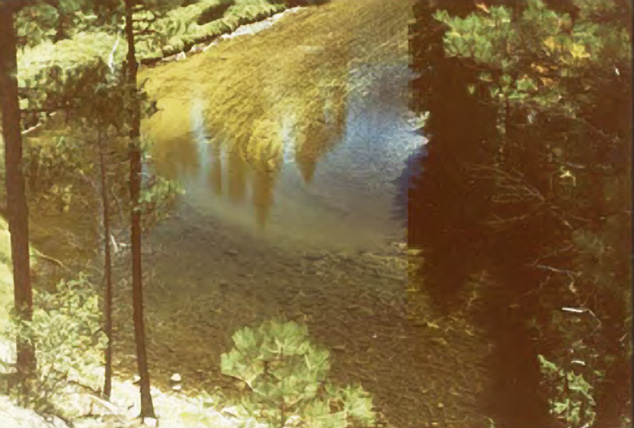
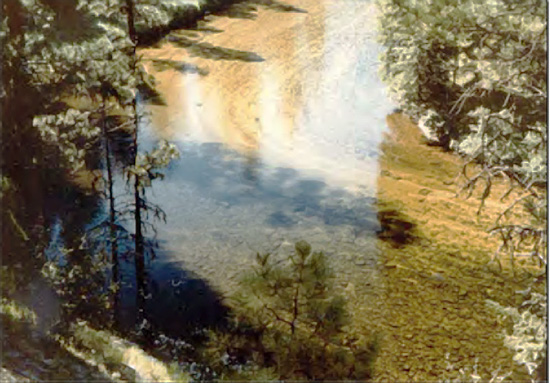
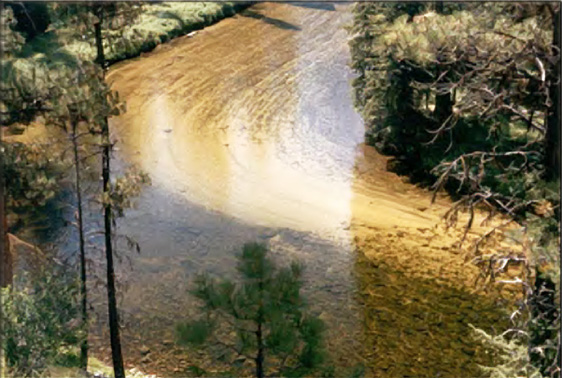
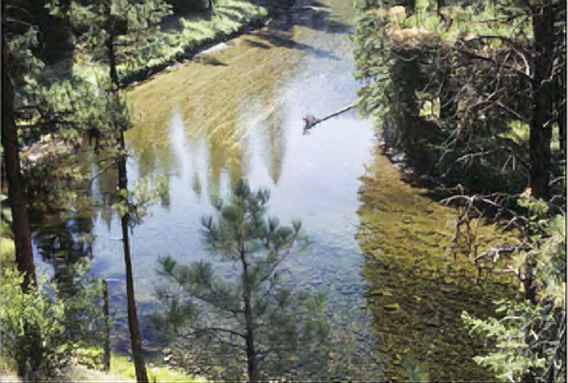
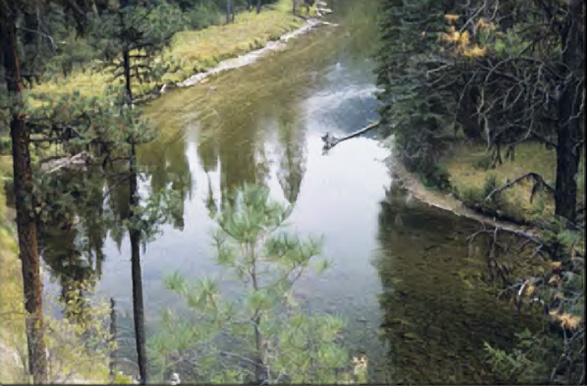
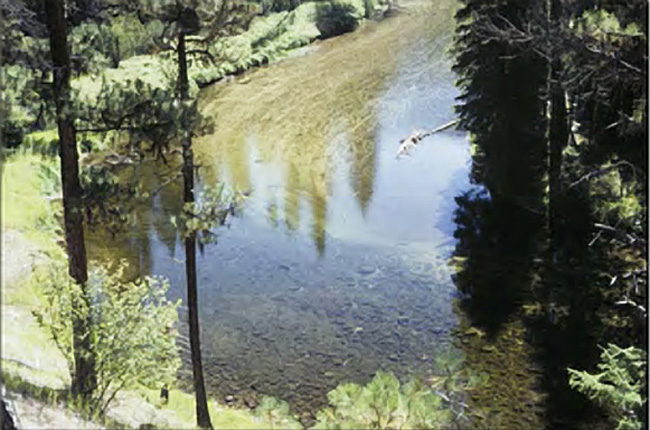
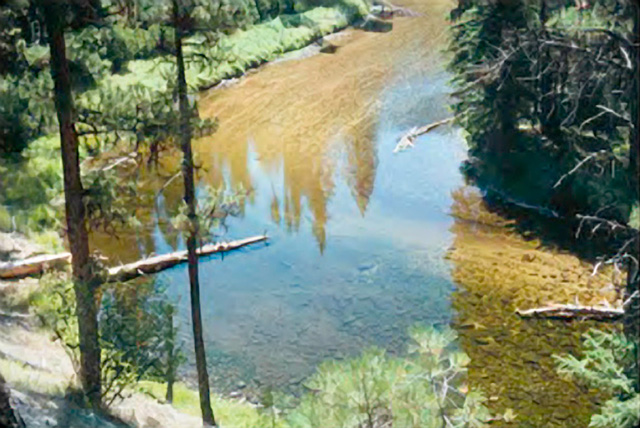
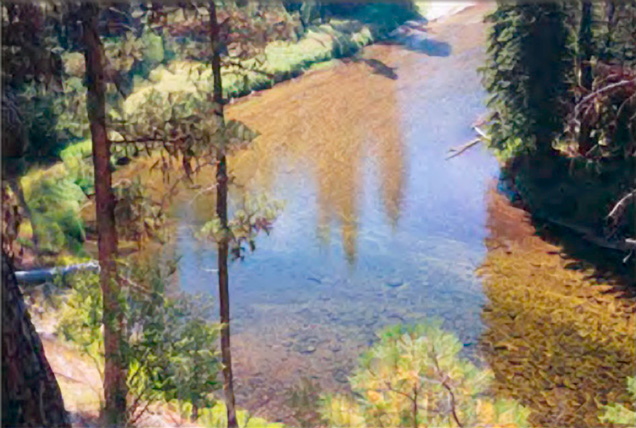
Siltation at Poverty Flats on the South Fork of the Salmon River is pictured in a series of slides taken from a single photo point over a period of 35 years beginning in 1965.The graph below shows the levels of fine silt measured at the same location over roughly the same time period. Examine both the slides and the Siltation graph and assess the suitability of the Poverty Flats spawning area.
1) What type of function best fits the data relating the Percent Fine Sediment and the Percent Egg Survival? Explain.
2) If you wanted to assure a 20% survival rate or better what percent fine sediment would you like to see in the chinook redds? Explain,
3) Suppose that on average that you discovered a 12% fine sediment level in a stream like the South Fork of the Salmon River. Explain what egg survival rate you would expect and how confidant you would be in your prediction.
4) Study the series of slides and describe the condition of this site over time. When do you notice the biggest change in the amount of silt?
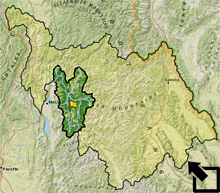
5) Poverty Flats is the only site in the South Fork basin where the percent of silt has actually increased since 1970. Other areas have seen a slight decrease. (a) What is the average rate of increase according to the graph and equation? and (b) study the map of the region and identify what man made factor(s) may be contributing to this increase.
6) There have been significant changes in the vegetation in the South Fork basin over the last five decades as a result of fire, logging, and climate change. Examine and describe the transformation using the ChangeMatters maps:
- Enter Warm Lake, ID in the search box,
- adjust the scale on the Map Navigator down three levels,
- drag Warm Lake to the south placing the Poverty Flats area in the center of the maps,
- use the Time Selector to examine changes in the region's vegetation over the last fifty years.
7) Study the graph above along with the graph of egg survival rates. What do the combined results suggest about the success of Poverty Flats as a chinook spawning area?
1"South Fork Salmon River Spring/Summer Chinook Population," 2011, in US Fish & Wildlife Service Salmon and Steelhead Recovery Plans for Idaho.
