Unit Objectives
- Understand the geographic and cultural reasons for the selection of the Hanford Reach area as a nuclear facility.
- Understand how exposure to radioactive waste from Hanford occurs and how it can contaminate humans.
- Use GIS software to analyze the spread of radioactive materials from Hanford and resulting health issues and describe these phenomena in narrative, graphical or mathematical terms as appropriate.
- Evaluate the health effects of exposure to radioactive waste from Hanford using both personal narratives of those affected and research studies.
Related National Standards
GIS Activities

GIS investigations are part of many of the activities in this unit. These investigations make use of ArcGIS Online, an internet software that runs on most browsers. If you do not have an ArcGIS account and would like to have one you can sign up for a free personal account here.
The data and shapefiles in the various map layers are from a variety of sources:
Columbia River Basin
boundary file from CRB Basin Boundary, 2008. ESRI.
Columbia, Snake, and Salmon River layers clipped from USGS National Hydrography Dataset
Tribal Boundaries
Historical boundary shapefile digitized from Early Indian Tribes, Culture Areas, and Linguistic Stocks - Western U.S., Perry-Casteneda Library Map Collection, courtesy of the University of Texas Libraries, The University of Texas at Austin.
Contemporary reservation boundary data clipped from Indian Lands of the United States layer, in the USGS National Atlas, 2006.
Explorers
Lewis & Clark Trail layer from Lewis & Clark Expedition: Route of the Corps of Discovery, 1804-1806, Redlands, CA: ESRI Schools and Libraries Program,1998.
Canneries
Cannery data from John N. Cobb, "Pacific Salmon Fisheries, Bureau of Fisheries Document No. 1092, Washington D.C.: US Department of Commerce, 1930 and Marshall McDonald, "The Salmon Fisheries of the Columbia River Basin," Washington D.C.: U.S. Commission of Fish & Fisheries, 1894.
Cannery images from John W. Tollman, 1897, University of Washington Libraries. Special Collections Division
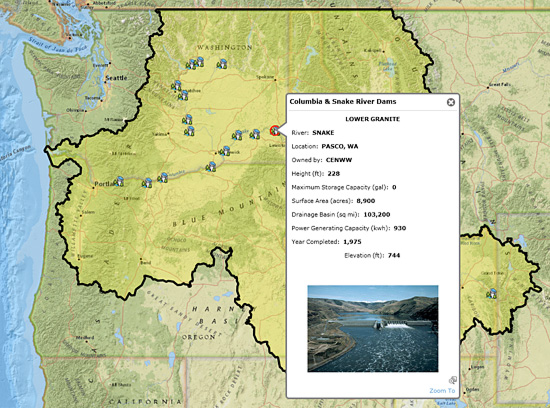
Dams
Dam related data from Reservoir Data: Project Data, U.S. Army Corps of Engineers, Water Management Division, 2003.
Dam images from U.S. Army Corps of Engineers Digital Visual Library.
Fish Count
Fish count data by dam from Adult Salmonid Passage, Columbia River DART (Data Access in Real Time) Project downloaded in February, 2012.
South Fork of the Salmon River
Columbia River Subbasin boundary file from CRB Basin Boundary, 2008. ESRI.
Land cover vegetation clipped from USGS, Landcover of the Pacific Northwest, National Gap Analysis Program (GAP), Land Cover Data Portal.
Roads and Salmon spawning layers from"South Fork Salmon Subbasin Geodatabase," Northwest Fisheries Science Center, downloaded December, 2012.
Fire history layer clipped from "Fire History Polygons for Northern Rockies- 1899-2003," U.S Forest Service, Northern Region, downloaded December, 2012.
Recovery
Recovery Populations layer courtesy of Dana Collins, Bonneville Power Administration, downloaded December, 2012.
Recovery Actions layer from Salmon Recovery June 2015- Habitat Restoration, Portland, Oregon: Bonneville Power Administration - GIS available on ArcGIS Online.
Additional resources
Those interested in learning more will find that the Internet offers a variety of interesting materials.
Joseph Cone and Sandy Ridlington, editors. Northwest Salmon Crisis: A Documentary History. Corvallis, Oregon: Oregon State University Press, 1996.
Salmon Recovery Federal Caucus website
University of Washington, School of Aquatic & Fishery Science, Columbia Basin Research website.
Contact
Your comments and suggestion about these materials are more than welcome.
If you have ideas for additional topics that would lend themselves to the approach taken here, please pass them along. I'd enjoy collaborating with you.