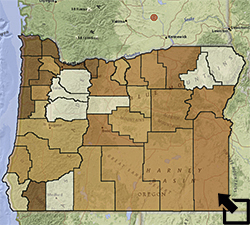
Concern about radioactive contamination from the Hanford site has existed since enriched plutonium was first produced there during World War II. In a 1965 Journal of Environmental Health article, Robert Fadeley reported a significant difference between cancer death rates in the nine Oregon counties down river from the Hanford plant and all other Oregon Counties.1 His study went on to correlate the cancer mortality rate per 100,000 population and an index to exposure to radiation in these counties.
Fadeley's index of exposure was itself a function of three separate variables. It was based directly on the extent of each county's river frontage and inversely on the product of the county's river distance to Hanford and the square of its average north-south distance to the river:
Index = F/SD, where
Index = index of exposure,
F = river frontage.
S = stream distance to Hanford, and
D = average depth of county2
The approach that Fadeley took emphasized water born contamination, noting that radiation was discovered to be magnified up the food chain from river plankton to fish and fowl and eventually to humans and other mammals. His approach did not take into account wind-borne exposure.
The data provided in the following activities are those that Fadeley used in his study as well as more recent cancer data from the period 2006 - 2011. It is presented here in three different formats: data maps, scatter plots, and data tables. As you will discover each has its advantages. Click the links below to view each in its own window.
The big picture provided in the map gives you a chance to explore for patterns in the cancer death rates related to place - in this case, Oregon counties:
Follow the Columbia River as it flows south through Hanford in Washington and then creates the border with Oregon on its way to the Pacific Ocean. Fadeley noticed the higher incidence of cancer mortality in the Columbia River counties - particularly along the lower Columbia - compared to the rest of the state. At that point he focused on these counties, created his Radiation Exposure Index, and looked at its relationship with cancer mortality. Looking at this data in each format is instructive. Make a map like the one below showing the Radiation Exposure Index for the nine Columbia River counties.
Change styles (  ) in the Columbia River Counties layer of the Hanford Map and create a map showing the Cancer 1964 variable, the cancer mortality rate in the counties along the Columbia in 1964. Along with the image above you will then have two maps that give you a geographic picture of the correlation of the two variables.
1) Is the correlation between Radiation Exposure Index and the Cancer Mortality Rate positive or negative? That is, are higher levels of one generally associated with higher rates of the other (positive) or lower rates (negative)? Describe how this aspect of the relationship between the two variables is apparent in the maps, in the data table, and in the scatterplot.
2) How strong is the correlation? Is there a distinct pattern (strong) or does the relationship appear random (weak) or somewhere in between?
3) Use the scatterplot of the relationship and determine the equation of the line of best fit. Describe what the slope of the line tells you about the relationship between the Radiation Exposure Index and the Cancer Mortality Rate.
4) Write a summary of the relationship you see in the data between river-borne exposure to radiation from Hanford and cancer mortality in the Oregon counties down river from the plant..
5) Read Fadeley's own summary of his research. Discuss similarities and differences with your own observations.
6) Recent cancer mortality data is available in the map, graph and table. Analyze and describe the relationship between the Radiation Exposure Index and Cancer Mortality Rate in 2011.
7) Critics of Fadeley's conclusions focused on the time it takes for cancer and death to result from radiation exposure. Do some research on this topic and comment.
1Robert Fadeley, "Oregon Malignancy Pattern Physiographicall Related to Hanford Washington Radioisotope Storage," Journal of Environmental Health 27:6:883-897, 1965.

