GIS in the History Classroom
In the Classroom - Telling Stories
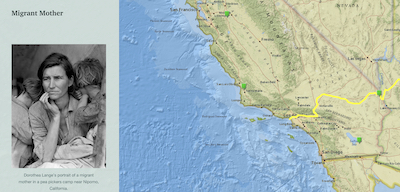
The tools associated with GIS software allow students to tell stories (or histories) in a variety of ways. Photo based map journals, content presentations, and time aware narratives are among the possibilities. The brief map journal suggested below tells a visual story of the dust bowl migration along Route 66 in a series of place related photos. A second set of slides outlines the basic steps in the creation of the story map.
An important aspect of any history is to credit sources, particularly, as in this visual story, the images involved. Copy and paste is simple; responsibly using another’s work as part of yours, not so much. For a contemporary map tour students should be encouraged to use their own visuals - no questions about ownership and a part of the creative process. For a historical tour, though, this is obviously not possible. There are, however, a variety of public domain and creative common sources of historical images and other materials that can be freely used - with credit to the creator (if known) and the source. The Digital Collection of the Library of Congress and Wikimedia Commons are two of the best examples. The North Carolina Department of Public Instruction provides Simple Copyright Guidelines for students as an aid in navigating the issues involved.
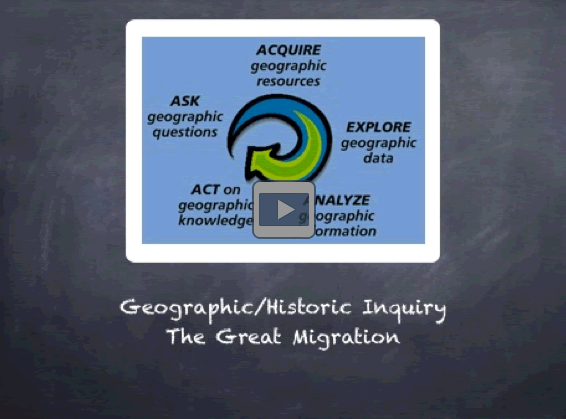
Maps can be nicely integrated into video slide presentations as well. Simply save a copy of your map(s) in an acceptable format (jpeg, for example) and insert them into your presentation as you would any other graphic. The short presentation at right offers an example of geographic inquiry related to the Great Migration of black Americans out of the southern states in the early twentieth century. The maps were prepared in ArcGIS Map Viewer, saved as graphic images, and inserted into two of the slides. Open the presentation.
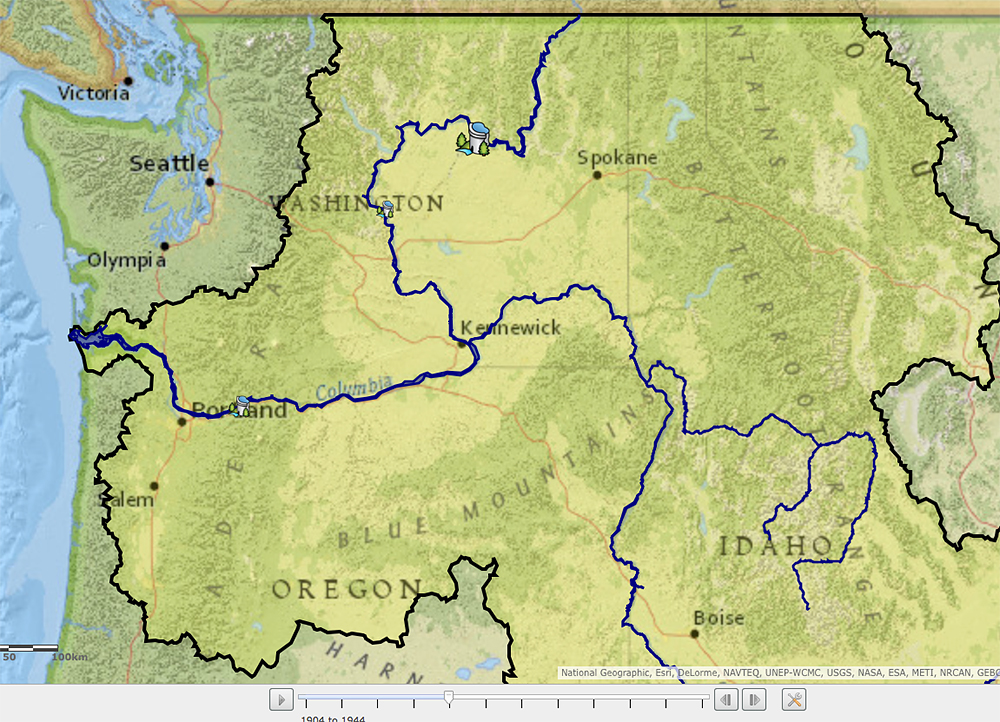
History obviously occurs in time as well as place. Making time an element of a geographic presentation is, therefore, an important aspect of applying GIS in the history classroom. This requires including a time field in a GIS database with data stored in an appropriate unit (e.g. - year, decade, century, etc.) making possible the addition of the fourth dimension as suggested in the map linked at left. Notice the slider beneath the map. It can be advanced decade-by-decade or as an animation showing the damming of the Columbia Basin Rivers beginning in 1905 and ending in 2010. By switching map layers from Dams to Average Fish Counts and then changing the time options to show only the current values, five year running averages of sockeye and chinook salmon and steelhead can also be followed through the same time period.
A recent series of maps put together under the leadership of Anne Kelly Knowles carries the element of time as a component of GIS significantly further. Knowles (2013) and her colleagues offer students a unique view of the Battle of Gettysburg addressing the question, “What could Lee and his generals see over the course or the three day battle?” The Gettysburg maps not only incorporate time in addressing this question, but include the ability to examine battlefield viewsheds and to explore panoramic scenes of the battlefield. Pickett’s Charge has never looked more like an exercise in blind faith


