GIS in the History Classroom
Why GIS? - Spatial Relations
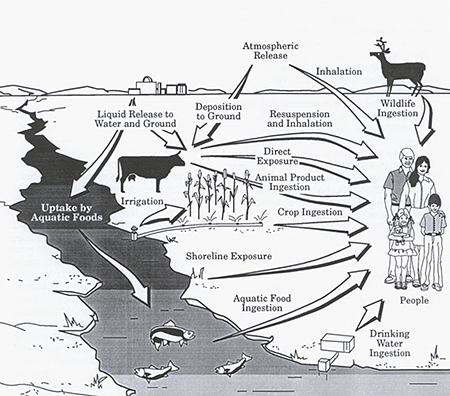
Hypothyroidism is a condition that results in the thyroid gland not producing enough of two hormones, thyroxine and triiodothyronine. It may be caused by a number of factors including exposure to radioactive iodine-131 as happened around the Hanford nuclear reactors in the first years of their operation. From 1945 to 1951 large amounts of the material were released into the atmosphere around Hanford. The chart at the right details the chain of events leading to human consumption, absorption into the body, and retention in the thyroid.
For students studying the issue and the history of atomic energy not only at Hanford, but worldwide, the question becomes “Is there a spatial pattern relating the incidence of hypothyroidism and the atmospheric release of radioactive iodine?”; that is, “Are these variables spatially correlated and, if so, how?” Access to public health data along with information related to the predominate wind patterns in the area allow students to explore questions like this in a highly visual way that the use of numbers alone in tables or graphs simply does not provide.
Image Gallery 2
Seeing Relations
A table of values may be of little value by itself
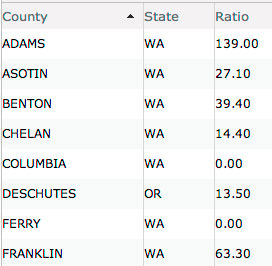
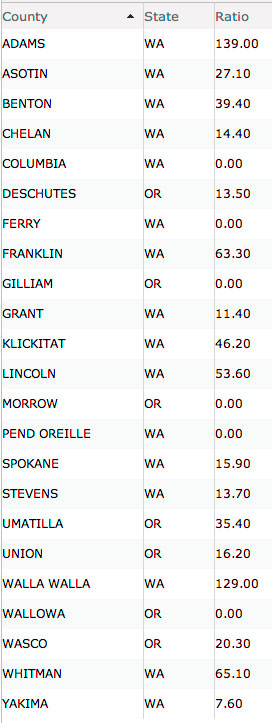
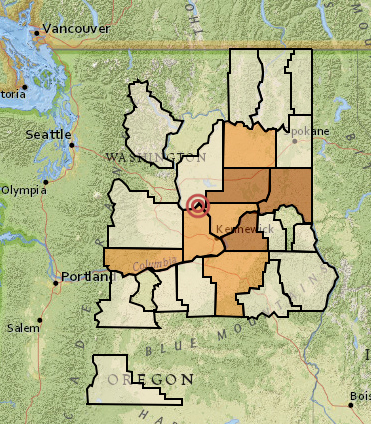
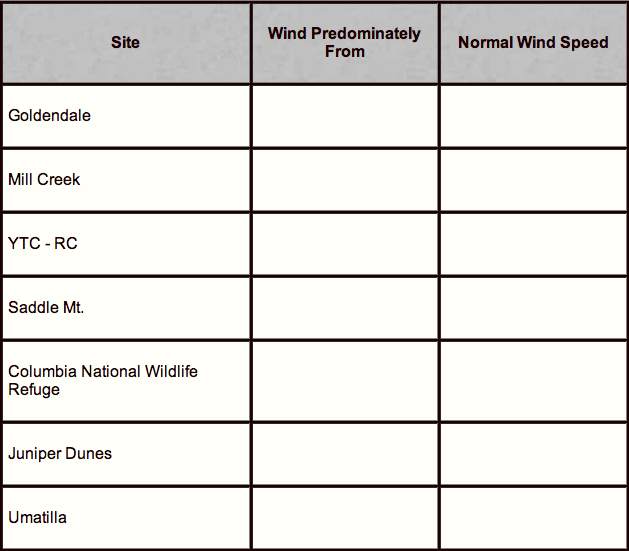
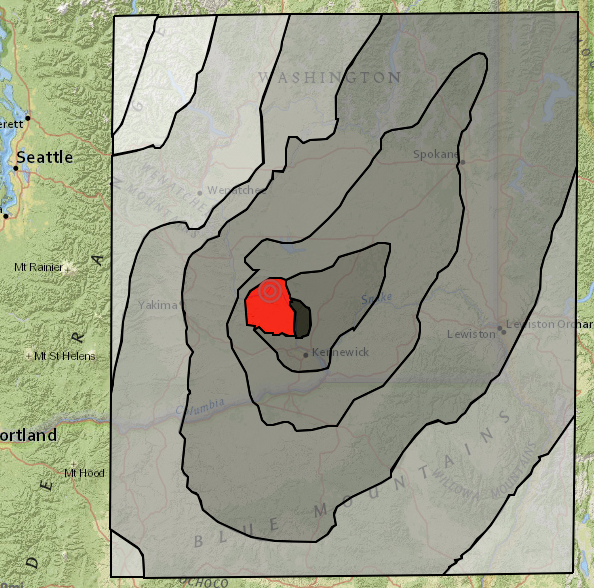
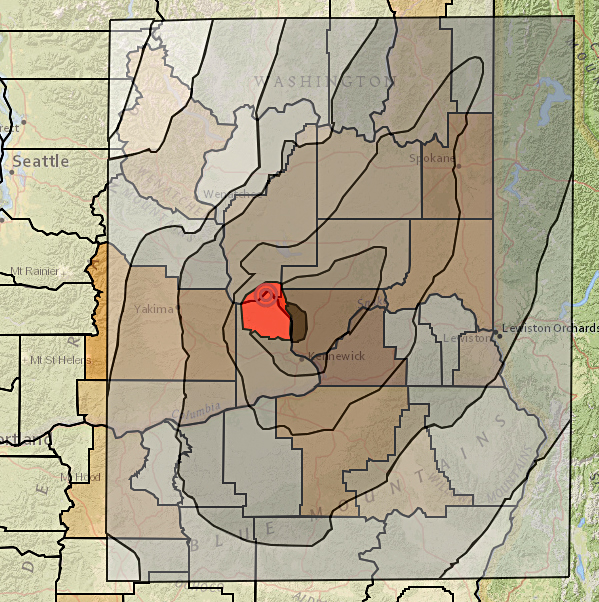
Imagine an exploration of the data in a strictly numeric form - hypothyroidism rates per 1,000 population organized alphabetically by county - as suggested in the first of the slides at the left. Yes, there is significant variation. Yes, many counties report zero cases. Yes, you could calculate basic statistics: mean, median, standard deviation, etc. However, unless you have knowledge of the location of the counties listed in relation to the Hanford Nuclear site; that is, unless you have a sense of the spatial relationship involved, the table is of limited value. Seeing the data in a thematic map (view slides) you can begin to address the question suggested earlier in a more meaningful fashion. Couple the map with information related to wind patterns in the surrounding area as well as the dispersal of radioactive iodine-131 from Hanford and a clear spatial picture emerges. There is a reasonably high positive correlation between the two variables - one that is easy to see. Armed with a visual understanding of the relationship, an important historical question arises for students:
Imagine an exploration of the data in a strictly numeric form - hypothyroidism rates per 1,000 population organized alphabetically by county - as suggested in the first of the slides at the left. Yes, there is significant variation. Yes, many counties report zero cases. Yes, you could calculate basic statistics: mean, median, standard deviation, etc. However, unless you have knowledge of the location of the counties listed in relation to the Hanford Nuclear site; that is, unless you have a sense of the spatial relationship involved, the table is of limited value. Seeing the data in a thematic map (view slides) you can begin to address the question suggested earlier in a more meaningful fashion. Couple the map with information related to wind patterns in the surrounding area as well as the dispersal of radioactive iodine-131 from Hanford and a clear spatial picture emerges. There is a reasonably high positive correlation between the two variables - one that is easy to see. Armed with a visual understanding of the relationship, an important historical question arises for students:
“Is the epidemiology of the situation consistent with the firsthand reports of affected downwinders?" Here, again, GIS software provides an opportunity for a big picture, general view of the historical situation to be weighed against specifics provided by more traditional historical sources. Open the lesson plan for an idea of how this might play out in the classroom.


