GIS in the History Classroom
Technical Issues - Accessing Data
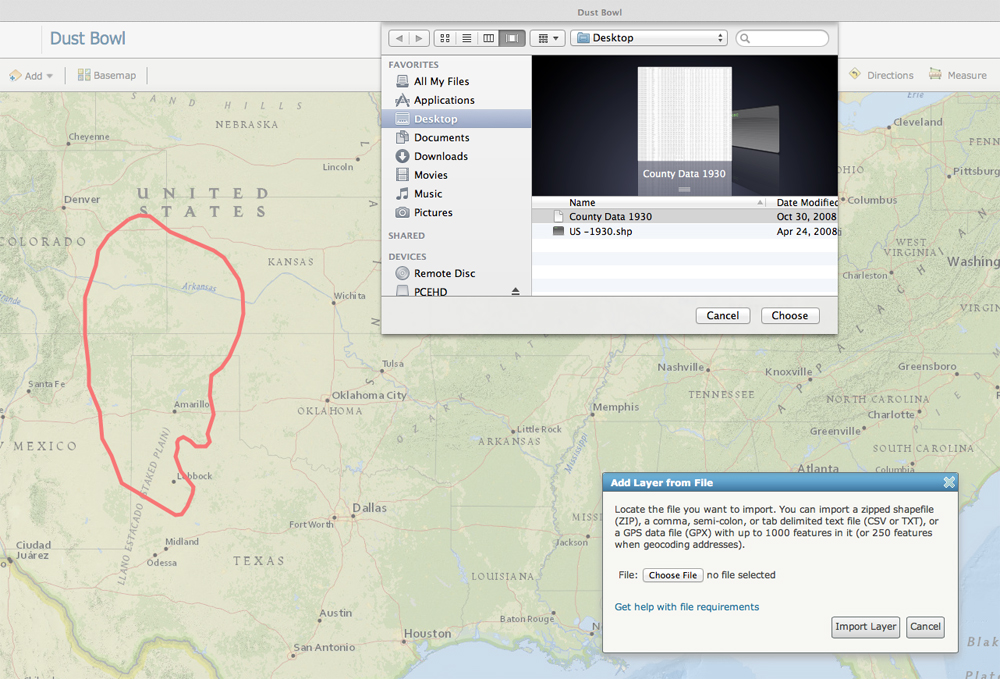
Making online maps using data sources like those provided by ArcGIS Online is relatively easy. Simply open a new map and add any of the thousands of readily available layers. However, incorporating historical data is not necessarily so simple. It often requires extensive research to find available data. Its accuracy, authenticity, and reliability needs to be examined. And, finally, data must be given appropriate geographic reference before a map can be made available to students in an easy-to-use form.
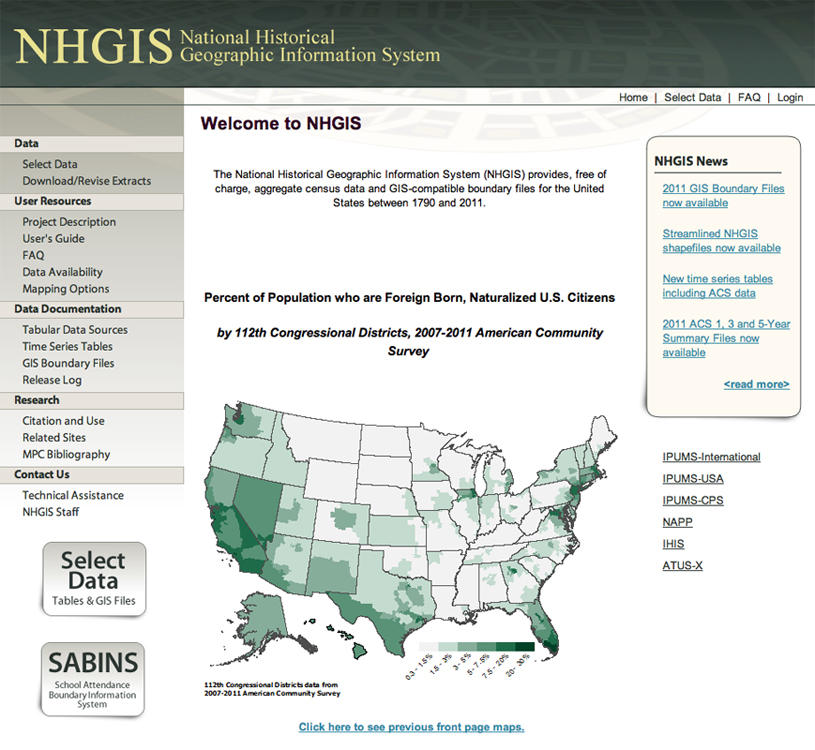
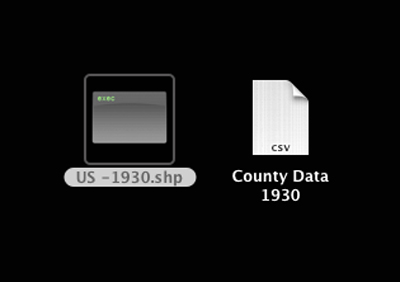
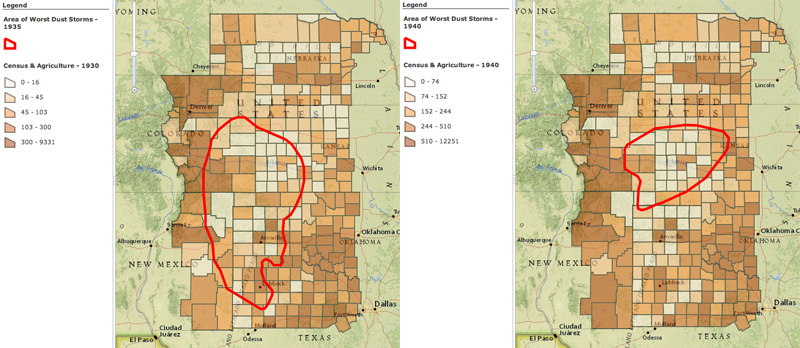
If you are lucky, the process may only require that you download shape and data files from a resource like NHGIS (National Historical Geographic Information System) and add them to your map. In the example here, census and agricultural census data were downloaded from the NHGIS for 1930, 1940, and 1950 and made part of a Dust Bowl map. Students can use the map to easily compare Great Plains demographic, economic, and agricultural data across two decades.
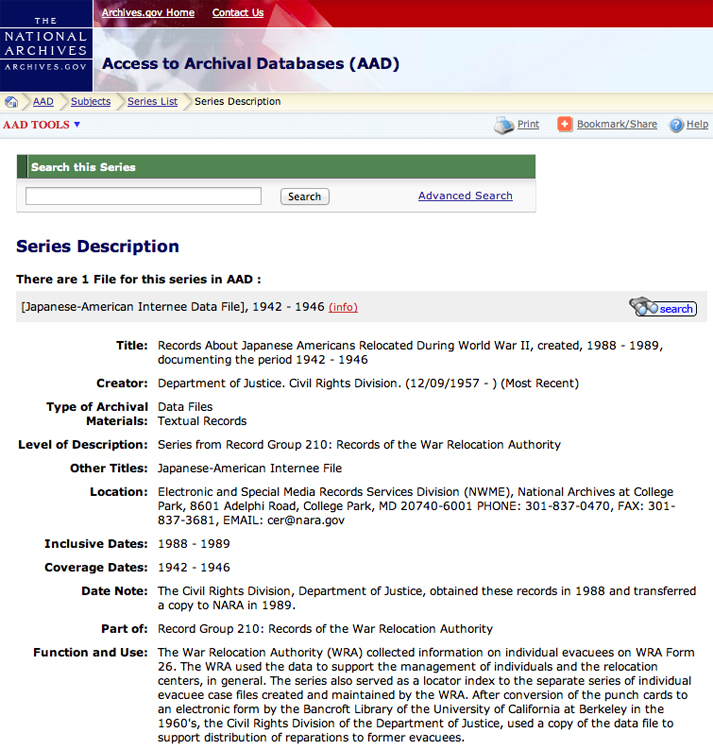
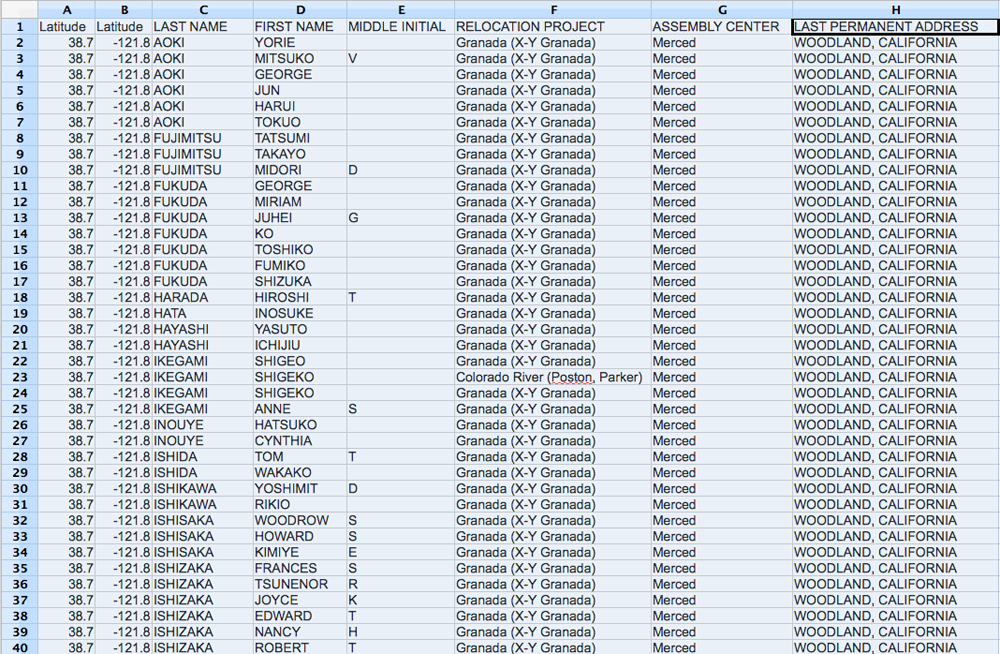
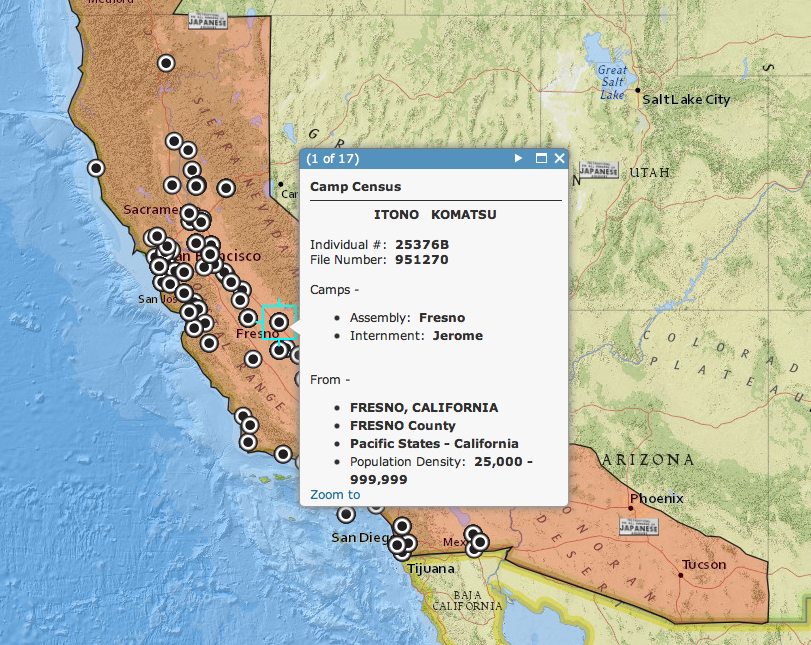
Data is often available in a digital form, but lacking locational information or perhaps the file is too large for convenient online classroom use. In such cases you will need to create a manageable random sample and include a geographic component for each record before you can add the data to a map for student use. The data in this example comes from a census of Japanese Americans completed in 1942 at the start of their internment. It was digitized and put in the National Archives in 1988 and made available for public use. However, before it could be used as a layer in a GIS file the latitude and longitude of the each internee’s former residence had to be added. Because of the size of the file (approximately 110,000 records) a random sample of approximately three percent of the individuals in the entire file was created.
The detail in the file allows students an important insight into the Japanese American community in 1942 allowing them to analyze the validity of the stereotypes of the day (Japanese Internment: A Profile).
In this example, locating the hometown of each individual in the internment file was simply a matter of looking up latitude and longitude of still existent modern cities and towns. However, such precision is not always possible with historical locations. A similar census was completed in 1835 detailing the lives of members of the Cherokee tribe before their removal from the southeastern United States to the Oklahoma Territory ( The Cherokee Removal: Examining Conclusions). Locations in the census were most often given in terms of nearby rivers and streams (e.g. - Lookout Creek, Pine Log Creek). Old maps of the Cherokee territory and more detailed modern maps had to be consulted to determine approximate locations. As a result, the precision of the resulting Cherokee Removal map of individual families is obviously limited, a fact that the existence of points in a computerized file often obscures. However, the access to a broad source of census information about the Cherokee in 1835 can help students create a more comprehensive picture of the entire tribe, particularly when viewed against some of the popular misconceptions and propaganda of the day:
The present condition of both Creeks and Cherokees who still remain in the states is most deplorable. Starvation and destruction await them if they remain much longer in their present abodes.
William Lumkin, governor of Georgia,
in a letter to President Andrew Jackson, 1835
The Cherokees are idle, uncultivated, and destitute of most of the comforts of life.
Rev. Ezra Styles Ely, Presbyterian minister,
in an 1830 editorial in the newspaper the Philadelphian
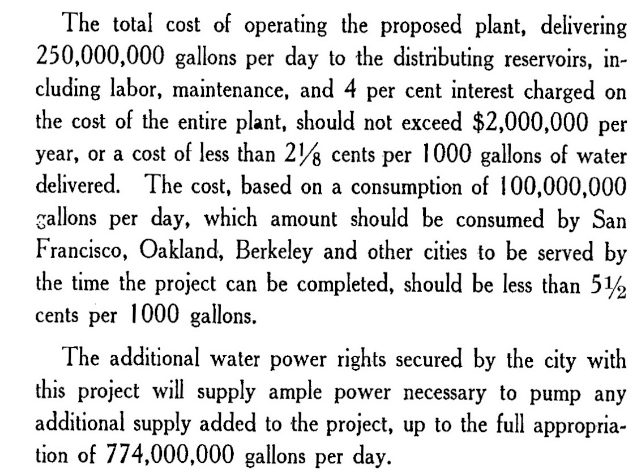
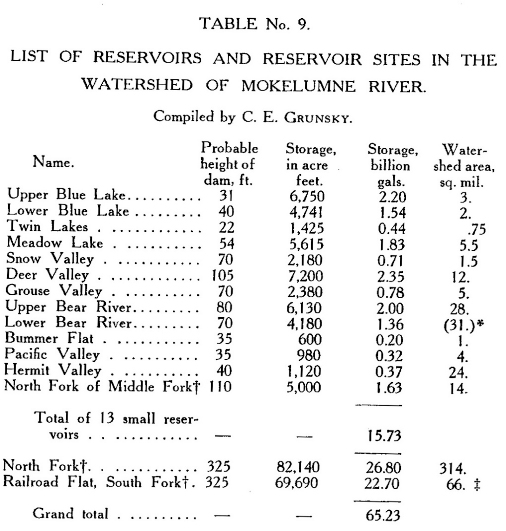
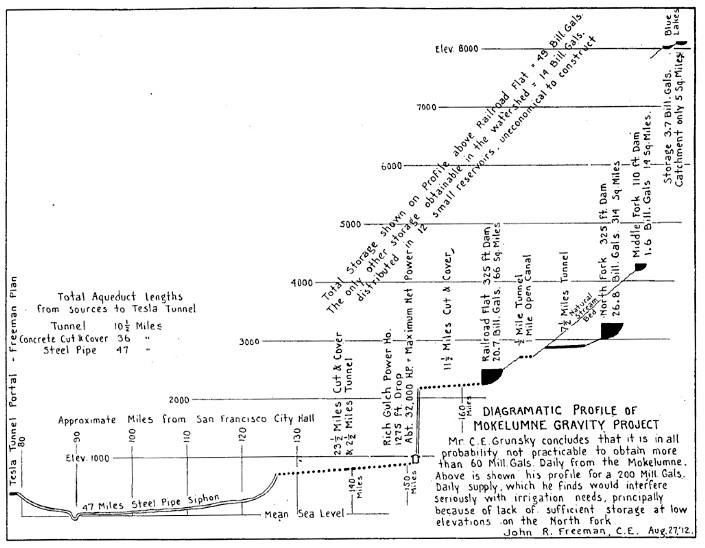
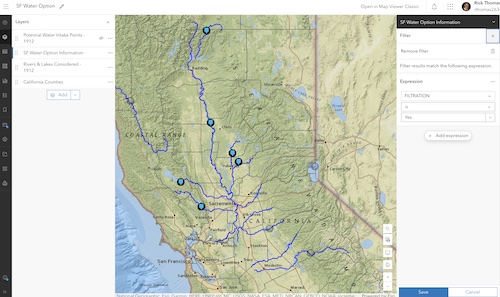
In many cases you may have to dig into a variety of historical sources, extract the desired data, and create a digital file from scratch including the data and geographic references to make the information part of a map for classroom use. The data sources in the sequence here provide an example.
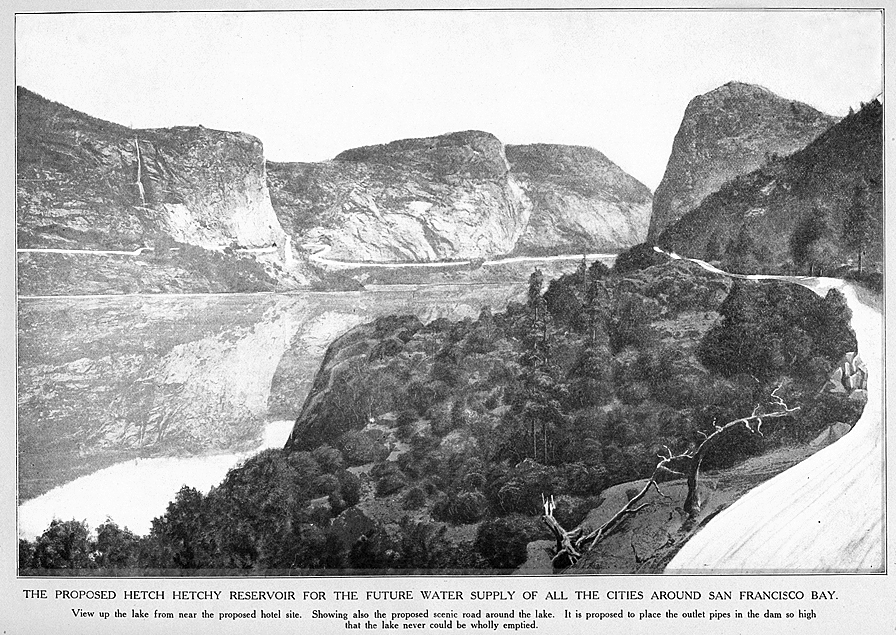
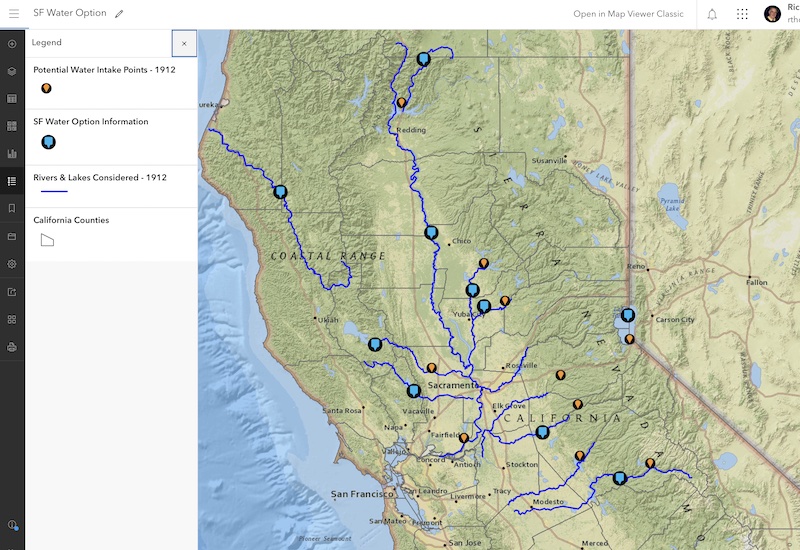
Following the 1906 earthquake and the resulting fires the city of San Francisco gained an upper hand in its attempt to dam the Tuolumne River in Yosemite National Park as a municipal water source. Need for an adequate water supply and public safety trumped the scenic value of a seldom seen valley despite its location in Yosemite National Park. The city had considered a number of potential sources and each was examined by city engineers over a period of more than twenty years. Data and conclusions related to these alternatives were included in a report to Congress in 1913 - an elaborate 250 page book in which pertinent detail was buried in text, tables, and graphics. The obfuscation was intentional. The thinking was that Congressmen rushing to adjourn before the Christmas holidays would not get past the introduction with its glossy depiction of San Francisco’s first choice - the Hetch Hetchy Valley and the Tuolumne River. Most did not. President Wilson signed the Hetch Hetchy bill into law on December 19, 1913.
A GIS map would be an obvious format for such a presentation today. Putting one together would allow students easy access to information about the alternatives and a chance to simulate the decision that confronted Congress in 1913 ( Hetch Hetchy: Preservation or Public Utility - Examining the Alternatives ).


